
Are Bottleneck Calculators Accurate or Misleading?
The Reality Of Percentages
To quickly check if PC’s components are balanced, gamers, editors, and coders use online bottleneck calculators instead of consulting experts. However, many of these tools give misleading results, like showing a “60% bottleneck” even when real-world gaming performance remains smooth. So, are bottleneck calculators accurate? The answer depends on the tool.
While the idea behind these calculators is helpful, most online versions rely on generic data rather than actual system testing. As a result, readings can vary wildly, where one calculator may show zero bottleneck, while another reports a major CPU limitation using the same parts. They also often ignore key factors such as resolution, game type, RAM speed, cooling, monitor refresh rate, and driver behavior. In real games, a “15% bottleneck” frequently has no noticeable impact.
Our bottleneck calculator stands apart. By factoring in RAM type, storage, PSU, resolution, and real benchmark data, it gives a precise and reliable view of CPU-GPU balance. This guide breaks down when bottleneck calculators are accurate and what people often get wrong about the results.

How Accuracy Is Determined in Bottleneck Calculators
To answer “Are bottleneck calculators accurate?”, the truth is, it depends on the tool and what it factors in. Most online calculators give rough estimates because they only consider limited data, but our GPU-CPU bottleneck calculator provides reliable results by accounting for all key components, real benchmarks, and user-specific conditions.

How Accuracy Is Determined in BottleneckCalculators
To answer “Are bottleneck calculators accurate?”, the truth is, it depends on the tool and what it factors in. Most online calculators give rough estimates because they only consider limited data, but our GPU-CPU bottleneck calculator provides reliable results by accounting for all key components, real benchmarks, and user-specific conditions.
Generalized Algorithms and Conflicting Results
Most online calculators rely on static formulas and benchmark sets. They assign a single percentage to a system without considering scene complexity, driver updates, or engine behavior. That’s why the same CPU-GPU pair can show zero bottleneck on one site but appear limited on another. Our tool, however, factors in dynamic workloads and real benchmarking data to give accurate results.
Real-World Context vs Theory
Calculators compare CPU and GPU specs from databases, but real performance depends on resolution, thermals, driver versions, and game engine logic. For example, a Ryzen 5 with RTX 4070 may show a “20% CPU bottleneck” at 1080p, but at 1440p or 4K, the FPS remains smooth because the load shifts to the GPU. Our calculator accounts for these real-world variations.
Comprehensive Component Analysis
Most online calculators focus narrowly on CPU and GPU, ignoring PSU stability, VRM quality, motherboard limits, cooling, and background tasks. Two PCs with identical specs can perform differently due to airflow, thermal paste, or RAM configuration. Our tool evaluates these factors to provide a more accurate bottleneck estimate.
Task-Specific Performance
Performance varies between gaming, rendering, and other workloads. A system flagged as CPU-limited for a synthetic test might run smoothly in GPU-heavy games. Our calculator lets you specify the intended use: gaming, video editing, or general productivity, so you get a relevant, accurate assessment.
Resolution and Graphics Settings
Resolution heavily impacts CPU-GPU balance. A bottleneck at 1080p may disappear at 4K because the GPU workload increases while CPU demand stays similar. Features like DLSS or ultra textures further shift the balance. Our calculator adjusts for resolution and settings for a true reflection of performance.
CPU Usage Realities
Calculators often assume all CPU cores are equally loaded. In reality, many games use only a few cores heavily while others remain idle. Our tool considers single-thread limitations and multi-core behavior to give a realistic view of potential CPU bottlenecks.
Overclocking and Optimization
Stock benchmarks don’t account for overclocking, voltage tuning, or cooling improvements. Our calculator allows users to include these variables, reflecting how optimized systems perform compared to theoretical stock predictions.
Up-to-Date Hardware and Software Data
Online calculators rely on outdated benchmarks and cannot track new GPU drivers, CPU microcode updates, or OS patches. These changes can improve FPS, reduce stutter, or alter component load. Our tool continuously updates data and incorporates driver and game optimizations for accurate results.

When Bottleneck Calculators Are Correct &Reliable
Bottleneck tools help new PC builders understand which components need balancing before purchasing parts. The biggest help? Spotting potential CPU bottlenecks early. GPU bottlenecks are easy to fix by lowering your graphics settings or resolution. But CPU bottlenecks can’t be fixed by adjusting settings. A weak CPU causes stuttering, frame drops, and inconsistent performance that no graphics adjustment can solve.
For example, take a Ryzen 5 5600 with an RTX 3060 Ti (both mid-range components). A calculator will show around 6-7% CPU bottleneck, meaning the pairing works well with minimal performance left on the table. But pair that same Ryzen 5 5600 with an RTX 4080? The calculator jumps to 30%+ bottleneck, warning you that the CPU can’t feed that powerful GPU properly. The exact percentage might be off, but the message is clear. Bottleneck calculators actually warn you before you buy a powerful GPU that your CPU can’t keep up with.
Bottleneck Calculator Mistakes to Avoid
PC builders misunderstand what bottleneck numbers mean and make incorrect assumptions about system performance. Here are some Bottleneck calculator myths you shouldn’t believe:
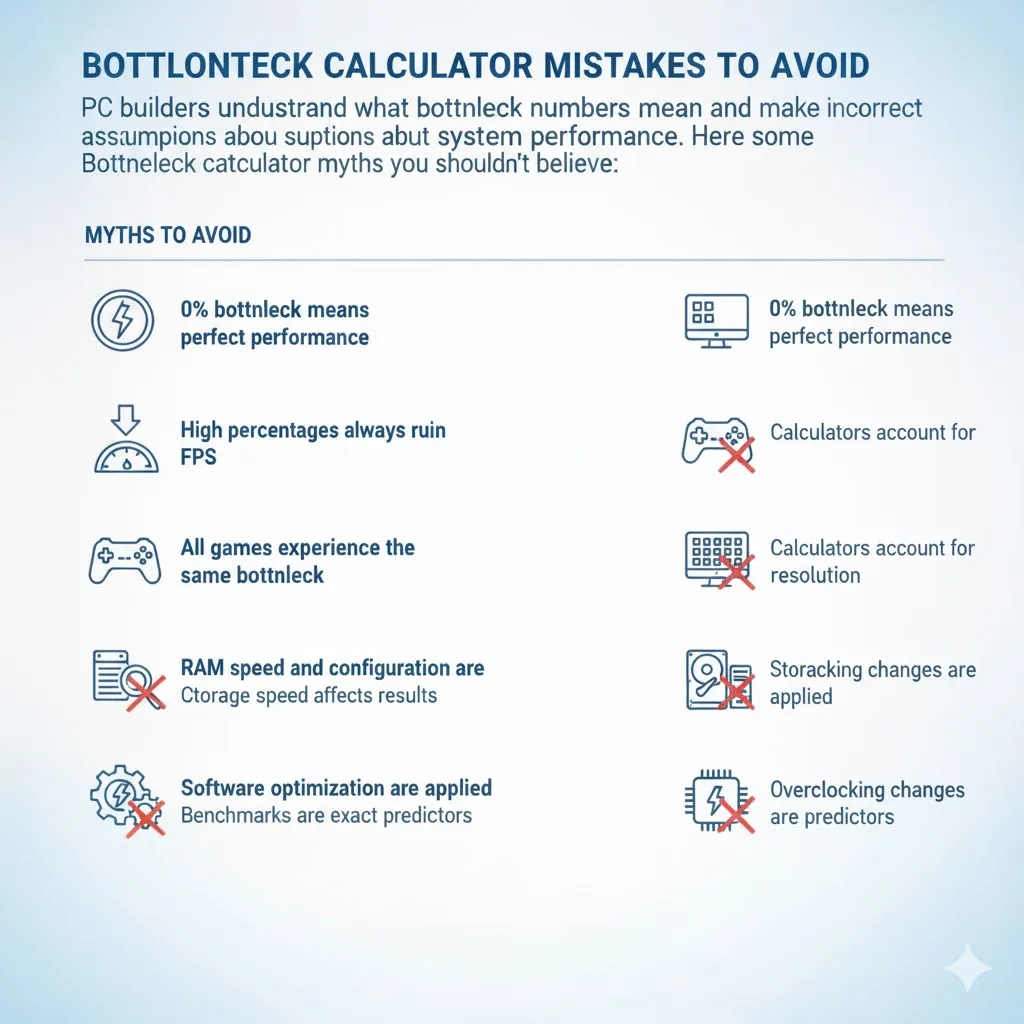
Always treat bottleneck results as estimates rather than final verdicts, and always cross-check with real benchmarks using tools like 3DMark or MSI Afterburner for in-game monitoring.
Understanding PC Bottlenecks and How Calculators Estimate Them
A PC bottleneck happens when one part of your PC works more slowly than the others, causing the faster parts to wait. Any component can create a limit, but a CPU-GPU mismatch is the most common. “Bottlenecks” aren’t a sign of a poor build (unlike what people believe), they show which component is under the most load. Games shift between CPU-heavy and GPU-heavy tasks, so bottlenecks appear only in certain scenarios.
Bottleneck calculators estimate this performance gap by generating a percentage or score for the limiting component. For instance, a system with an AMD Ryzen 7 5800X CPU and NVIDIA GTX 1650 GPU will hit a GPU bottleneck in demanding 1080p games. The CPU handles the load easily, while the entry-level GPU limits performance. Calculators highlight such mismatches, but actual results vary depending on resolution, game optimization, and component tuning.
A reliable calculator that incorporates real benchmarks and system factors provides a closer estimate of performance, helping identify which component may need upgrading.
Bottleneck Calculators Tested: Accuracy, Features, andBenchmarks
Bottleneck calculators provide a rough idea of system balance, but our tool goes further, factoring in RAM, storage, PSU, and real benchmark data. You get a clearer picture of actual performance compared to typical online calculators. Here’s how it stands out:
| Feature Analyzed | Our Bottleneck Calculator | Typical Competitor Tool |
|---|---|---|
| CPU & GPU Matching | Uses live benchmark data and workload behavior to judge balance | Compares paper specs with little context |
| RAM | Accounts for RAM type and speed impact on CPU load | Often skipped or treated as minor |
| Storage Type | Factors SSD vs HDD impact on load times and system strain | Commonly ignored |
| Power Supply Impact | Checks PSU wattage and stability to flag possible throttling | No PSU evaluation |
| Usage Scenario | Let users pick gaming, rendering, or office workloads for accurate context | Assumes gaming only |
| Resolution & Settings | Adjusts predictions based on display resolution and quality settings | Sticks to fixed defaults |
| Real-World Verification | Encourages cross-checking with benchmarks and usage overlays | No follow-up guidance |
Conclusion
Should you trust bottleneck calculators? Yes, but only as a light reference. They simplify complex behavior and often miss context, which is why bottleneck calculator myths and facts circulate so easily. Real performance depends on resolution, game design, driver updates, cooling, and how each scene shifts the workload. CPU and GPU limits trade places constantly, and no setup avoids that entirely. Your PC will always have a bottleneck in some form. As long as it’s working well and the game is running, there’s no need to worry about percentages. Bottleneck calculators are decent for quick comparisons, not for real behavior.
Frequently AskedQuestions